SPSS analysis of patient satisfaction survey information
Amy R. Burton's Page

Home

My Resume | About Me | Favorite Links | Scleroderma - a condition that is dear to my heart | Baylor | SPSS Patient Satisfaction | the page that Amy built | Contact Me

Research Question:  Is patient satisfaction a function of branch of service and Beneficiary Category?

Using 18 months of patient satisfaction survey data, a query was performed in SPSS (Statistical Program for the Social Sciences) to determine if patient satisfaction with the quality of medical care received is a function of beneficiary category and branch of service.
 
Univariate Analysis of Variance was conducted. 


Dependent Variable: Q5 HOW SATISFIED W MEDICAL CARE RECEIVED AT CLINIC

Independent Variables:  Beneficiary Category and Branch of     Service

Tests of Between-Subjects Effects

Source

Type III Sum of Squares

df

Mean Square

F

Sig.

Corrected Model

742.614

17

43.683

21.247

.000

Intercept

104994.036

1

104994.036

51067.421

.000

MSERVICE

49.903

2

24.952

12.136

.000

MBENEGRP

298.938

5

59.788

29.080

.000

MSERVICE * MBENEGRP

98.230

10

9.823

4.778

.000

Error

44382.626

21587

2.056

Total

825247.000

21605

Corrected Total

45125.240

21604

a R Squared = .016 (Adjusted R Squared = .016)

Descriptive Statistics

Dependent Variable: Q5 HOW SATISFIED W MEDICAL CARE RECEIVED AT CLINIC

  Service

Ben Group

Mean

Std. Deviation

N

1 USA

1        A/D

5.66

1.470

1815

2  Dep/AD

5.80

1.524

2743

3   Retiree

6.19

1.446

3163

4 D/R-D/S

6.08

1.445

3598

5    Guard

5.48

1.669

102

6     Other

5.96

1.287

106

Total

5.97

1.483

11527

2 USAF

1        A/D

6.04

1.363

694

2  Dep/AD

6.10

1.321

846

3   Retiree

6.22

1.499

541

4 D/R-D/S

6.15

1.567

766

5     Guard

6.12

1.219

43

6      Other

6.43

1.078

47

Total

6.13

1.428

2937

3 USN

1        A/D

5.97

1.351

1663

2  Dep/AD

5.87

1.429

2729

3   Retiree

6.23

1.395

1365

4 D/R-D/S

6.22

1.266

1276

5    Guard

5.56

1.434

52

6     Other

5.70

1.595

56

Total

6.02

1.387

7141

Total

1        A/D

5.85

1.415

4172

2  Dep/AD

5.87

1.460

6318

3   Retiree

6.21

1.438

5069

4 D/R-D/S

6.12

1.425

5640

5    Guard

5.64

1.534

197

6     Other

6.00

1.353

209

Total

6.01

1.445

21605

What this all means-
 
Patient Satisfaction for respondants differed significantly between Branches of Service and Beneficiary Categories.
 
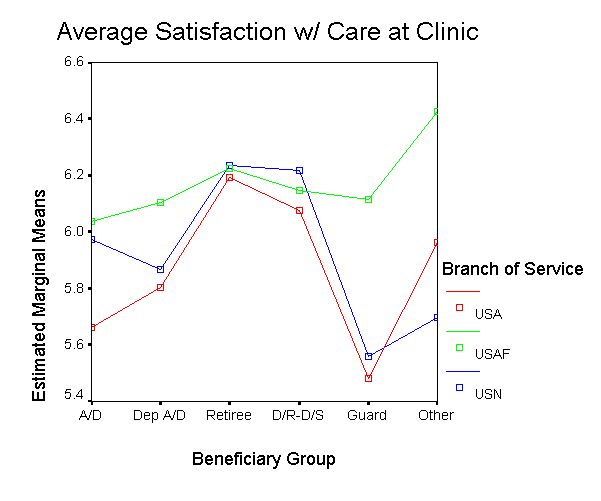
Although all respondants had an average score that indicated that they were "Somewhat Satisfied with the Quality of Care Received", satisfaction among Active Duty Army and Guard (much smaller Guard population than AD/USA) were the lowest.  Retirees of all branches of service appeared to be more satisfied than the Dependents of each branch of service.
 
Graph of Patient Satisfaction
meansplot.gif
Plotted by Service and Beneficiary Category

This graph shows the average respondents rating of their satisfaction (As per Question 5) on the vertical axis and the beneficiary categories on the horizontal axis.

The respondents rated their satisfaction according to the following scale:

1-      Completely Dissatisfied

2-      Very Dissatisfied

3-      Somewhat Dissatisfied

4-      Neither

5-      Somewhat Satisfied

6-      Very Satisfied

7-    Completely Satisfied